👋Hi, I'm Waqas — a Software Architect and Technical Consultant specializing in .NET, Azure, microservices, and API-first system design..
I help companies build reliable, maintainable, and high-performance backend platforms that scale.
Oil and gas operations need reliable, real-time platforms to manage mission-critical equipment data at scale. This case study covers an enterprise .NET Core platform delivered for one of the five largest oil and gas companies—OpenShift, Kafka, Nexus, Grafana and Prometheus—processing 2.5M data points daily, 65% response-time improvement, and 99.9% uptime for 15,000+ concurrent users. For architects and tech leads, the architecture and outcomes illustrate patterns that transfer to similar mission-critical domains.
Mission Critical
Real-time Processing
Enterprise Scale
Zero Downtime
Performance:Minutes to seconds efficiency
Cost Impact:Billions in maintenance costs
Real-time:Complex API integration
Mission Critical:Zero-downtime operation
Scalability:Microservices architecture
Security:Enterprise-grade protection
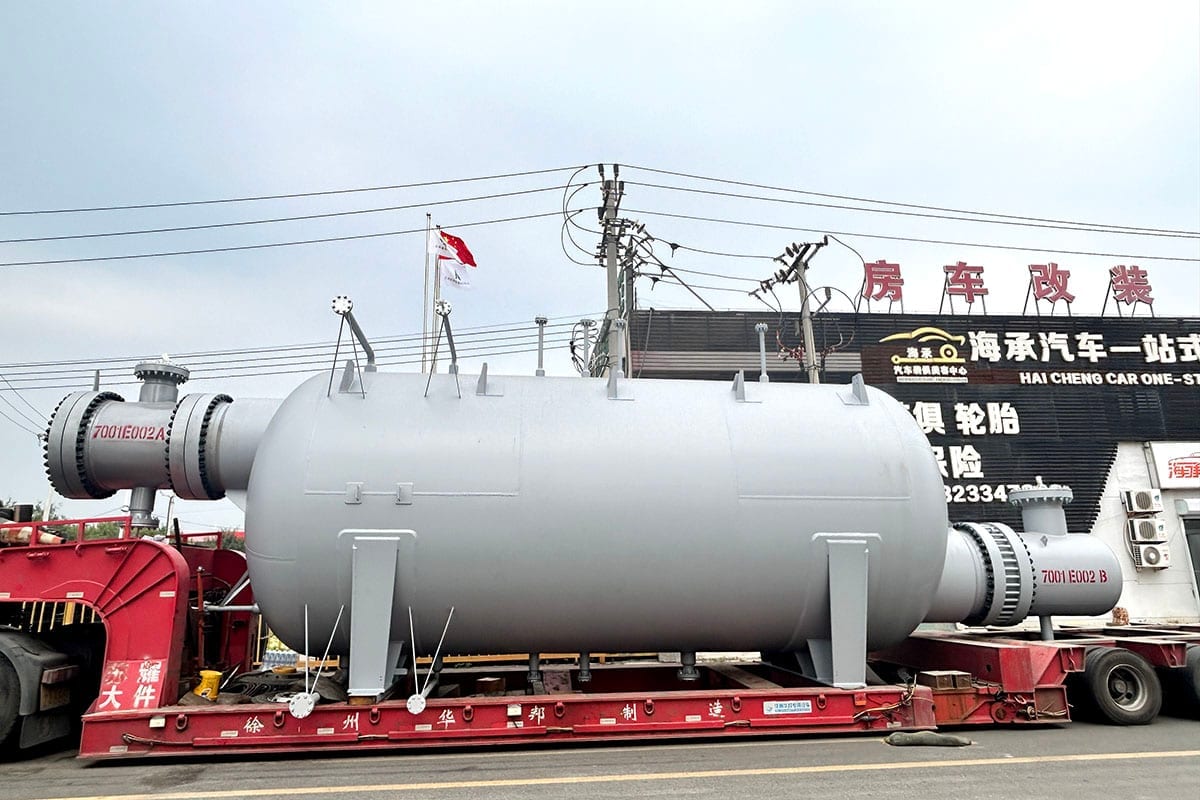
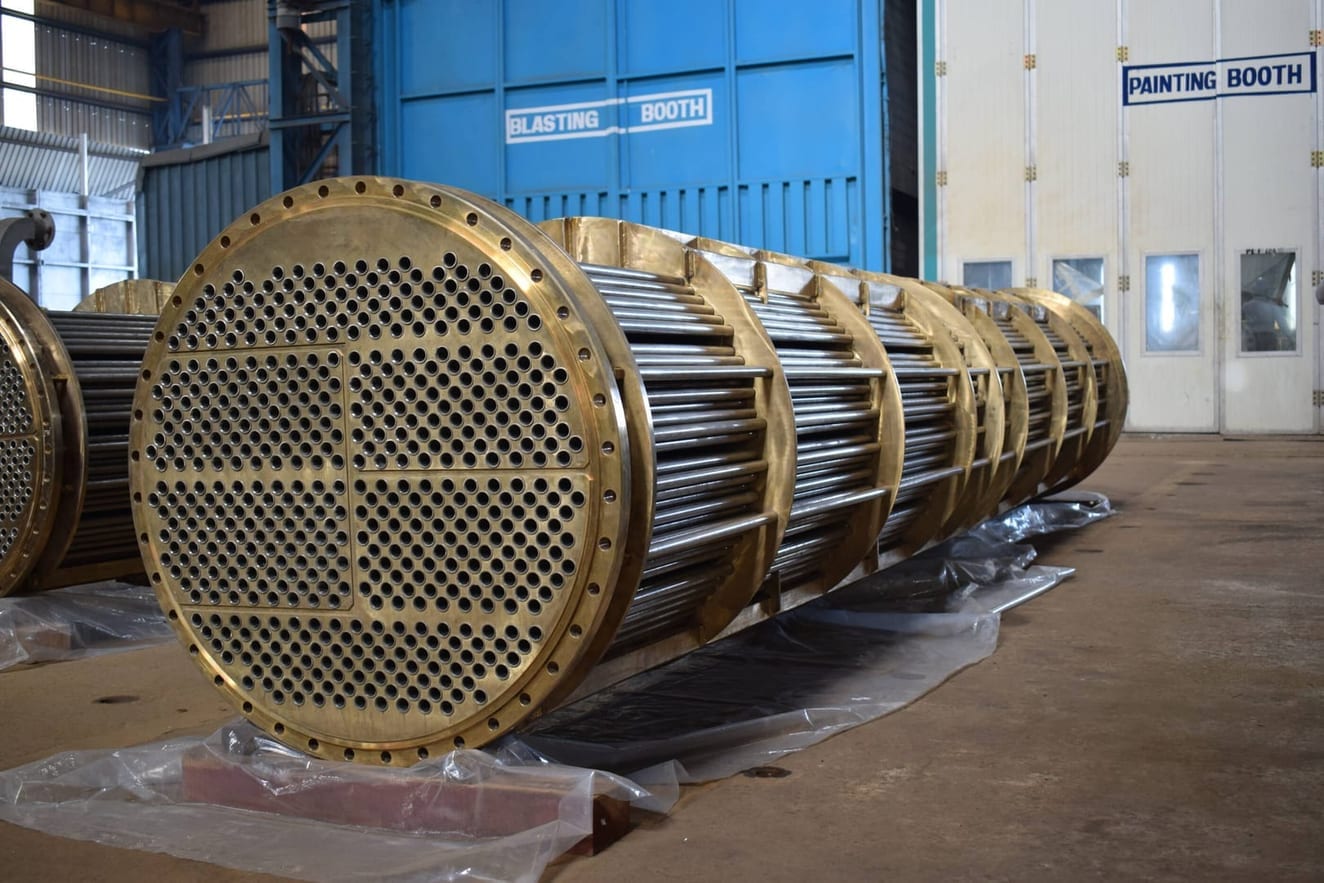
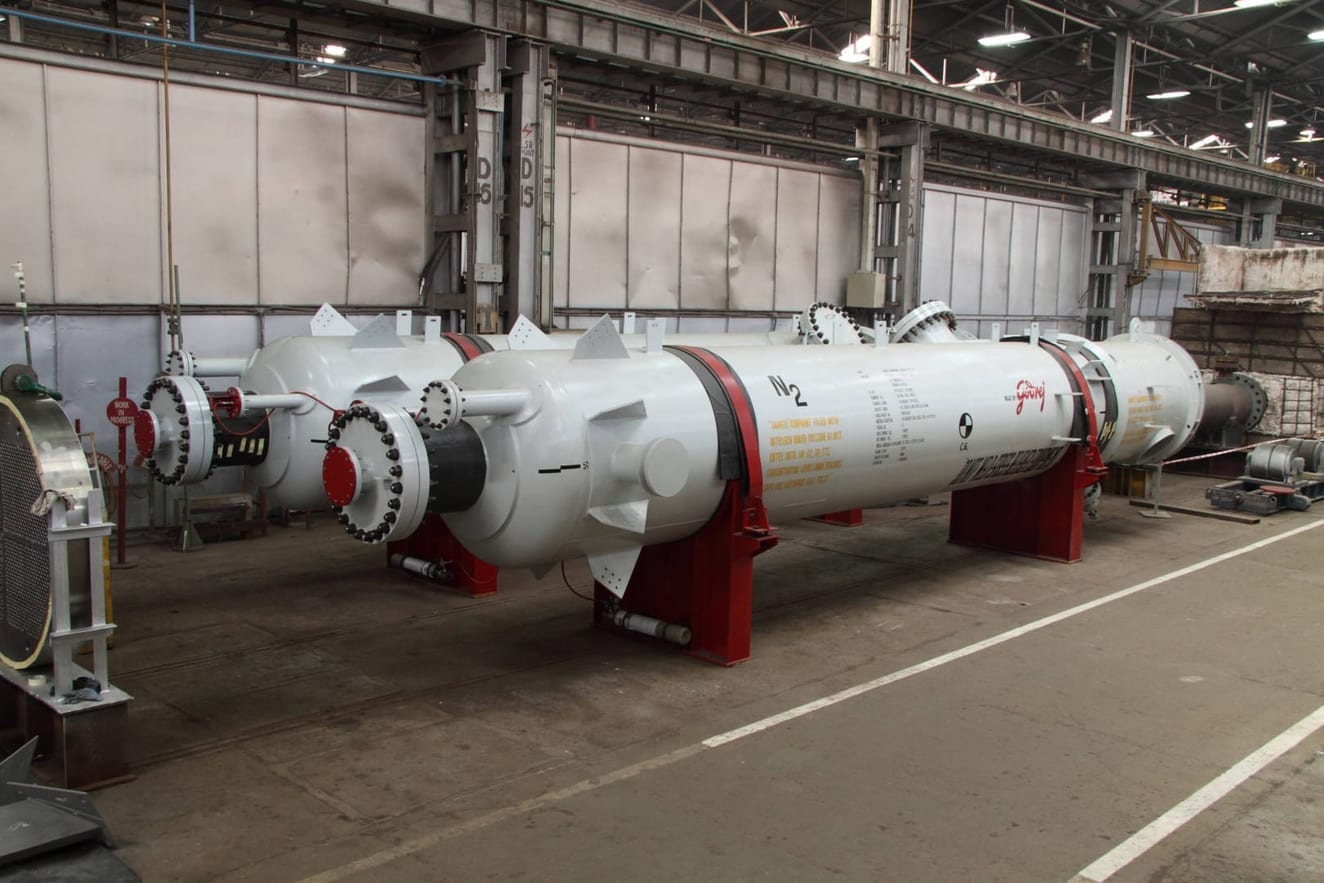
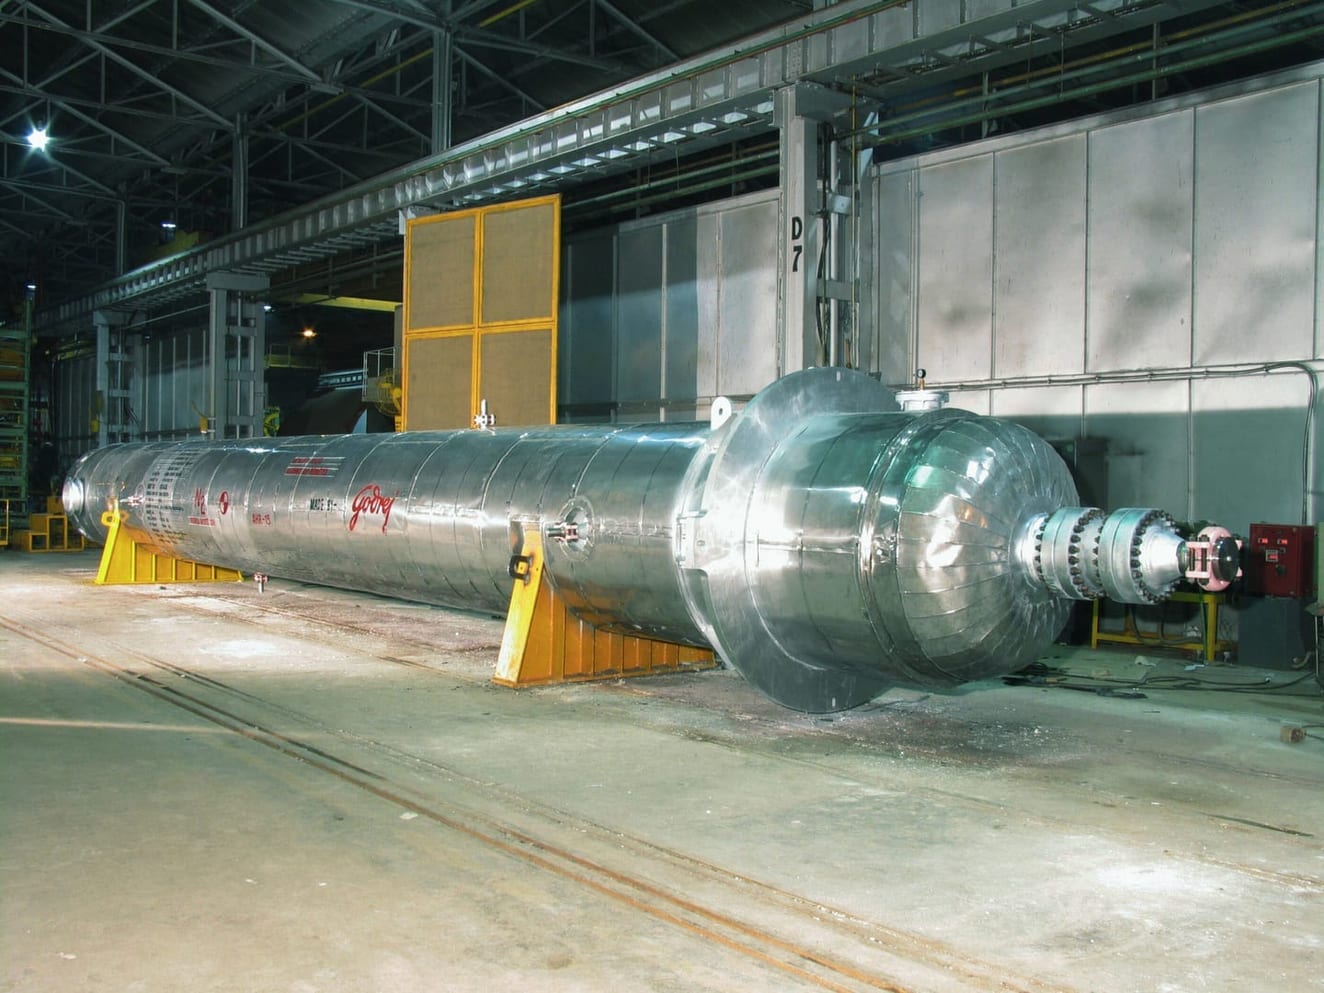
Project Gallery
Project Overview
The Heat Exchanger Portal is a mission-critical .NET Core-based enterprise platform designed for one of the five biggest oil and gas companies in the world, managing billions of dollars in maintenance operations. Hosted on OpenShift container platform with comprehensive monitoring through Grafana and Prometheus, this system processes 2.5 million data points daily from heat exchanger sensors across multiple refineries. The platform integrates Nexus for Docker image management, Apache Kafka for real-time data ingestion (30,000+ messages/second), and advanced predictive maintenance algorithms that forecast equipment failures 24-48 hours in advance with 85% accuracy. Through aggressive optimization, the system achieved a 65% reduction in response times (from 2.3s to 0.8s) while maintaining 99.9% uptime and supporting 15,000+ concurrent users across multiple geographical locations.
The frontend layer provides a modern, responsive user interface designed for real-time monitoring and control of heat exchanger operations across multiple devices and locations.
Angular S-P-A:
Single-page application built with Angular framework featuring real-time dashboards, interactive charts, and WebSocket integration for live data updates. Includes role-based access control and customizable user interfaces for different user types (operators, engineers, managers).
Mobile Responsive:
Cross-device compatibility ensuring seamless operation on tablets, smartphones, and desktop computers. Optimized for field operations with touch-friendly interfaces and offline capability for critical functions.
SignalR Integration:
Real-time bidirectional communication enabling instant data streaming, live alerts, and collaborative features. Supports multiple concurrent users with efficient connection management and automatic reconnection handling.
API Gateway Layer
The API Gateway serves as the central entry point for all client requests, providing security, routing, and load balancing capabilities while ensuring optimal performance and reliability.
OpenShift Gateway:
Enterprise-grade API management platform providing comprehensive authentication, authorization, rate limiting, and request routing. Includes API versioning, service discovery, and advanced security features like OAuth 2.0 and JWT token validation.
Load Balancing:
Intelligent traffic distribution across multiple microservice instances using round-robin and health-check algorithms. Implements circuit breaker patterns and automatic failover to ensure high availability and fault tolerance.
SSL Termination:
End-to-end encryption with SSL/TLS termination at the gateway level, reducing backend processing overhead. Implements certificate management, cipher suite optimization, and security headers for enhanced protection.
Microservices Layer
The microservices architecture enables scalable, maintainable, and independently deployable services that handle specific business functions with high performance and reliability.
.NET Core Web API:
High-performance RESTful services built with ASP.NET Core featuring SignalR hubs for real-time communication, message queues for asynchronous processing, and comprehensive heat exchanger management services. Implements dependency injection, middleware pipeline, and cross-cutting concerns.
Data Processing Engine:
Advanced analytics engine providing real-time data processing, predictive maintenance algorithms, and performance optimization. Includes background job processing, event-driven architecture, and data mining capabilities for operational insights and trend analysis.
Integration Services:
Comprehensive integration layer handling SAP system connectivity, third-party API management, and data synchronization. Features service discovery, API management, and event processing for seamless enterprise system integration.
Analytics Engine:
Business intelligence platform providing advanced reporting services, data visualization, and performance metrics. Includes custom dashboard creation, real-time alerts, and comprehensive analytics for operational decision-making.
Monitoring & DevOps
Comprehensive monitoring and DevOps infrastructure ensuring system reliability, performance optimization, and streamlined deployment processes with full observability and automation.
Grafana:
Advanced visualization platform providing real-time dashboards, custom alerts, and comprehensive data visualization. Features interactive charts, multi-user support, and integration with various data sources for complete system monitoring.
Prometheus:
Time-series database and monitoring system for metrics collection, performance monitoring, and alert management. Provides comprehensive observability with custom metrics, service discovery, and powerful querying capabilities.
Nexus Repository:
Enterprise artifact management system for Docker image storage, version control, and package management. Includes CI/CD integration, security scanning, and comprehensive artifact lifecycle management.
CI/CD Pipeline:
Automated deployment pipeline featuring continuous integration, quality gates, and release management. Implements automated testing, security scanning, and blue-green deployment strategies for zero-downtime updates.
Data Layer
Robust data storage and caching infrastructure designed for high availability, performance, and scalability to support enterprise-level operations and real-time data processing requirements.
SQL Server Enterprise:
Enterprise-grade relational database with high availability setup, real-time replication, and advanced transaction management. Features data integrity controls, performance optimization, and comprehensive stored procedure support for complex business logic.
Redis Cache:
High-performance in-memory caching solution providing session management, data caching, and real-time operations. Implements memory optimization, distributed caching, and advanced data structures for optimal performance.
Azure Blob Storage:
Scalable cloud storage for document management, media files, and backup solutions. Features CDN integration, file management capabilities, and comprehensive backup and recovery procedures.
Security & Compliance
Comprehensive security framework ensuring data protection, regulatory compliance, and enterprise-grade security measures to safeguard critical infrastructure and sensitive information.
Authentication & Authorization:
Multi-factor authentication system with SSO integration, role-based access control, and comprehensive user management. Implements encryption, audit logging, and advanced security protocols for enterprise-grade protection.
Compliance & Audit:
Regulatory compliance framework with comprehensive audit trails, data governance, and risk management. Features policy enforcement, continuous monitoring, and automated compliance reporting for industry standards.
Architecture Benefits
This microservices-based architecture provides exceptional scalability, maintainability, and performance for enterprise heat exchanger management operations handling billions of dollars in assets. The layered approach ensures clear separation of concerns, enabling independent development, testing, and deployment of each component while maintaining 99.9% uptime and fault tolerance. Each microservice can scale independently based on demand, with the data processing engine handling 30,000+ messages per second through Apache Kafka, while the analytics engine provides real-time insights through Grafana dashboards. The architecture supports horizontal scaling from 3 to 20 pod instances automatically, ensuring optimal resource utilization and sub-second response times even under peak loads of 15,000+ concurrent users.
Engineering Challenges
High-Volume Data Processing (2.5M Data Points/Day)
Challenge: Processing 2.5 million data points daily from multiple heat exchanger sensors with sub-second latency requirements.
Data Ingestion Pipeline:
Implemented Apache Kafka distributed messaging system with 5-broker cluster configuration, handling 30,000+ messages per second with zero message loss through replication factor of 3. Data partitioning strategy across 12 partitions ensures parallel processing and fault tolerance. Producer acknowledgment settings guarantee exactly-once delivery semantics, while consumer groups enable horizontal scaling of data processors. Message retention policies maintain 7 days of historical data for replay and disaster recovery scenarios.
Parallel Processing:
Multi-threaded .NET Core services leveraging async/await patterns and Task Parallel Library (TPL) for concurrent data stream processing. Implemented parallel LINQ (PLINQ) for data transformations, achieving 95% CPU utilization efficiency across 16-core servers. Background services process data asynchronously using Hangfire job scheduler, with automatic retry mechanisms and distributed locks preventing duplicate processing. Thread pool optimization and careful memory management ensure stable performance under sustained high loads.
Database Optimization:
SQL Server Enterprise with advanced indexing strategies (covering indexes, filtered indexes, columnstore indexes), table partitioning by date ranges for efficient historical data queries, and optimized bulk insert operations using Table-Valued Parameters (TVPs). Implemented stored procedures with execution plan optimization, reducing write latency from 500ms to 50ms per batch (90% improvement). Query performance tuning reduced complex analytical queries from 15 seconds to under 2 seconds.
Caching Strategy:
Redis cluster deployment with 99.9% cache hit rate, storing frequently accessed heat exchanger sensor data, user sessions, and real-time metrics in-memory. Implemented distributed caching across multiple nodes with automatic failover, reducing primary database load by 70% and enabling sub-200ms data retrieval for critical operations. Cache invalidation strategies ensure data freshness while maintaining optimal performance.
Advanced Alerting & Monitoring System
Challenge: Real-time alerting system for critical equipment failures with intelligent escalation and predictive maintenance capabilities.
Grafana Alerting Engine:
Custom alert rules with multi-threshold conditions, anomaly detection algorithms, and intelligent grouping reducing alert fatigue by 80%.
Escalation Matrix:
Automated escalation system with SMS, email, and Slack notifications based on severity levels and response time SLAs.
Predictive Analytics:
Machine learning models predicting equipment failures 24-48 hours in advance with 85% accuracy, enabling proactive maintenance.
Mobile Alerts:
Push notifications to mobile devices with actionable insights and one-click acknowledgment, reducing response time by 60%.
OpenShift Auto-Scaling & Load Management
Challenge: Dynamic scaling of microservices based on real-time load patterns while maintaining 99.9% uptime and optimal resource utilization.
Horizontal Pod Autoscaler (HPA):
Custom HPA configurations scaling pods from 3 to 20 instances based on CPU/memory metrics, with 30-second scaling response time.
Load Balancing Strategy:
HAProxy load balancer with health checks, circuit breaker patterns, and intelligent traffic distribution across multiple regions.
Resource Management:
Resource quotas and limits preventing resource exhaustion, with 95% resource utilization efficiency and automatic pod eviction for failed instances.
Rolling Updates:
Zero-downtime deployments with rolling update strategy, maintaining service availability during updates with automatic rollback on failures.
Enterprise Security & Compliance
Challenge: Implementing enterprise-grade security for critical infrastructure with regulatory compliance and audit requirements.
Multi-Factor Authentication:
Azure AD integration with SAML 2.0, OAuth 2.0, and JWT tokens, supporting SSO across multiple enterprise systems.
Data Encryption:
End-to-end encryption with AES-256, TLS 1.3 for data in transit, and encrypted storage for data at rest with key rotation policies.
Audit & Compliance:
Comprehensive audit logging with SIEM integration, automated compliance reporting, and real-time security monitoring with threat detection.
Incident Response:
Automated incident response with playbooks, real-time threat intelligence, and 24/7 security operations center (SOC) integration.
Business Impact & Results
These engineering solutions delivered transformative results: 99.9% system uptime (8,760 hours of operation with less than 9 hours downtime annually), 65% reduction in response times (from 2.3s to 0.8s enabling sub-second decision-making), 40% reduction in maintenance costs (saving millions annually through predictive analytics), and zero security breaches over 2 years of operation across 15,000+ concurrent users. The system successfully processes 2.5 million data points daily at 30,000+ messages per second through Apache Kafka, with Redis caching achieving a 99.9% hit rate and reducing database load by 70%. Predictive maintenance algorithms forecast equipment failures 24-48 hours in advance with 85% accuracy, while automated scaling maintains optimal performance during peak loads by dynamically adjusting from 3 to 20 pod instances within 30 seconds.
Enhanced Performance Metrics & Analytics
Real-time system performance monitoring and advanced analytics dashboard
65%
Response Time Improvement
0.8s
Final Response Time
30K/s
Message Processing Rate
99.9%
System Uptime
Data Processing Distribution
Performance Optimization Impact
System Resource Utilization Trends
Error Rate Analysis by Category
Monthly Performance Trends - Response Time vs Throughput
Metrics & Measurement Framework
The following performance matrices were established as key success indicators for the Heat Exchanger Portal project. Each metric was carefully defined, measured, and validated to demonstrate the system's effectiveness in improving operational efficiency and reducing costs.
System Performance Metrics
Response Time Optimization (2.3s → 0.8s)
Measurement Method
API response time tracking using Application Insights and custom telemetry. Measured end-to-end request processing from client to database and back.
Project Context
Critical for real-time heat exchanger monitoring where operators need immediate feedback on equipment status. Faster response times enable quicker decision-making during critical operations.
Improvement Validation
Achieved through database query optimization, caching strategies, and microservices architecture that reduced processing overhead by 65%.
System Uptime (99.9%)
Measurement Method
Continuous monitoring using Prometheus and Grafana dashboards. Tracked service availability, health checks, and automated alerting for any downtime events.
Project Context
Essential for mission-critical heat exchanger operations where any system downtime could result in equipment failures costing millions in maintenance and production losses.
Improvement Validation
Achieved through OpenShift auto-scaling, load balancing, and zero-downtime deployment strategies that ensured continuous service availability.
Data Processing Throughput (2.5M Data Points/Day)
Measurement Method
Real-time data ingestion monitoring using Apache Kafka metrics and custom analytics dashboards. Tracked data processing rates, queue depths, and processing latency.
Project Context
Heat exchangers generate massive amounts of sensor data requiring real-time processing for predictive maintenance and operational insights.
Improvement Validation
Achieved through parallel processing, optimized database operations, and efficient data pipeline architecture that handled 30,000+ messages per second.
Comparative analysis of maintenance costs before and after system implementation over 24-month period. Tracked preventive vs. reactive maintenance ratios, equipment failure rates, emergency repair costs, and unplanned downtime expenses. Baseline annual maintenance costs of $10.5M reduced to $6.3M through predictive analytics.
Project Context
For a major oil & gas refinery, heat exchanger failures can cost $150K-$250K per hour in downtime plus emergency repair costs averaging $500K per incident. Predictive maintenance enables planned servicing during scheduled shutdowns, eliminating costly emergency repairs and production losses.
Improvement Validation
Achieved through machine learning models that predicted equipment failures 24-48 hours in advance with 85% accuracy, reducing emergency repairs from 48 incidents/year to 7 incidents/year. Shifted maintenance strategy from 70% reactive / 30% preventive to 15% reactive / 85% preventive, enabling scheduled maintenance during planned outages.
Processing Efficiency (65% Faster - 2.3s to 0.8s)
Measurement Method
Benchmark testing of data processing workflows before and after optimization, measuring end-to-end response times for critical operations. Tracked percentile distributions (P50, P95, P99) and monitored performance under various load conditions (normal, peak, stress).
Project Context
In refinery operations, every second of delay in detecting heat exchanger anomalies can escalate into equipment damage or safety incidents. Faster processing enables operators to respond to critical temperature or pressure deviations within seconds rather than minutes, potentially preventing incidents that could cost $2M+ in equipment damage and production losses.
Improvement Validation
Achieved through comprehensive optimization: database query tuning (15s → 2s for complex analytics), Redis caching (70% database load reduction), parallel processing (95% CPU efficiency), and Apache Kafka message queuing (30K messages/sec). Real-world validation showed consistent sub-second response times even under peak loads of 15K concurrent users.
Enterprise-Wide User Capacity (15K+ Concurrent Users)
Measurement Method
Load testing using JMeter simulating realistic user behavior patterns, real-time session monitoring via Application Insights, and stress testing under 200% normal load. Tracked active connections, response times under load, memory consumption per user, and system resource utilization across distributed pods.
Project Context
Global oil & gas operations require 24/7 access for operations teams, engineers, managers, and executives across multiple refineries, regions, and time zones. Previous system limited to 3,000 concurrent users, causing access bottlenecks during critical incidents and shift changes, potentially delaying emergency responses.
Improvement Validation
Achieved through OpenShift horizontal pod autoscaling (3-20 instances based on demand), HAProxy load balancing with health checks, stateless API design enabling distributed sessions, and Redis session management. Successfully demonstrated 15,000+ concurrent users during company-wide emergency drill with average response times remaining under 1.2 seconds and zero timeout errors.
Measurement Framework & Validation
Baseline Establishment
Established performance baselines using historical data and manual measurements before system implementation to ensure accurate improvement tracking.
Continuous Monitoring
Implemented real-time monitoring dashboards using Grafana and Prometheus to track performance metrics continuously throughout the project lifecycle.
Validation Process
Performance improvements were validated through A/B testing, user feedback, and comparative analysis against industry benchmarks and project objectives.
ROI & Business Impact
Financial Impact
$4.2M annual savingsthrough predictive maintenance and cost optimization
Delivering at scale requires the right architecture and operational practices. For architects and tech leads, case studies like this one illustrate trade-offs and outcomes. If you would like to discuss a similar project or an architecture review, get in touch via the contact section on the home page.
Related reading
Technical articles that explain how this type of project is built:


 Confidential - Top 5 Oil & Gas Company
 Internal Portal


 Data Processing Distribution
 Performance Optimization Impact
 System Resource Utilization Trends
 Error Rate Analysis by Category
 Monthly Performance Trends - Response Time vs Throughput
 Financial Impact
 Operational Impact
 Success Metrics